Using Big Data to Predict Process Risks
Introduction
It’s a typical Monday morning scene at a refinery: the team – plant manager, supervisors, and head operators – gets together to review the past week. They talk about the industrial fluid-catalytic-cracking-unit and the key question, “how did our catalyst standpipe do?” The answer: “not great, and we’re not sure why.” Plant management knows the regenerated catalyst standpipe is prone to disturbances, which leads to frustrating operational ‘hiccups’ (and trips) every now and then. It’s one of the most profitable units in the refinery, with a best-in-class historian as well as manufacturing intelligence software. The systems generate hundreds of thousands of data points. Yet, the magnitude of risks and reliability associated with the standpipe (and how they change dynamically) remain unknown, creating challenges in managing for optimum efficiency.
This type of scene plays out again and again in refineries across the globe and is an indicator of a growing problem. With recent advances in control and monitoring systems, facilities are getting overloaded with more and more data – clear insights into how processes are performing or deteriorating are getting lost among the flood of information. Over the past few years, facilities have gone from a ‘not enough information’ challenge to a ‘too much information’ challenge. Now typically referred to as the ‘big data challenge’.
Big data is indeed big – typically, 5 billion data points for every 6 months of data for a plant with about 320 tags, recording sensor measurements every second. Lost in the flood of this big data are indicators that can help plants understand the dynamically changing risk and avoid some of the $10 billion lost to the US chemical and petrochemical industry every year (due to unexpected shutdowns). Our research at Near-Miss Management shows that taking a different-in-kind approach to harnessing big data – based on processing the information directly with advanced data mining techniques – creates a wealth of insights that were previously unavailable. This has significant potential to transform the way companies operate facilities and reduce unexpected disruptions. Our approach grows out of years of research with leading academic institutions and the work we have done with major corporations.
This white paper provides an overview of the gaps in current risk analysis activities and introduces an innovative approach to providing significant value for risk analysis initiatives. The shared objective is to help facilities prevent accidents and unexpected shutdowns, and operate reliably with predictive, reduced risk profile.
Gaps in Current Risk Analyses
While advances have been made in process risk management in the past few years, there still remain significant gaps that continue to hinder facilities. The Process Safety Management (PSM) approach that is now widely used to maintain and improve safety, operability, and productivity of plant operations, relies on risk assessment as a major component. It is in this area of risk assessment that challenges are ongoing.
1. Gaps in Quantitative Risk Assessment (QRA).
Typically, risk assessment is handled through QRAs conducted once or twice a year by most facilities. These use various data sources available to the industry, such as incident data, material safety data, and equipment and human reliability data, to identify incident scenarios and evaluate their risks by defining the probability of failure and their potential consequences. Thus helping users identify areas for risk reduction. However, because QRA mostly involves incident and failure data – excluding day-to-day alarm and process data that contain information on precursor events – it cannot achieve high predictive accuracies. Interestingly, a summary report by the Joint Research Centre and Denmark Risk National Laboratory of the European Commission* indicates that risk estimates based on generic reliability/failure databases are prone to biases and could result in large deviations depending on data sources. Their project employed seven partners that conducted risk analyses for the same ammonia storage facility, finding "large differences in frequency assessments of the same hazardous scenarios." For these reasons, the importance of utilizing process-specific databases for objective risk analyses has been gaining recognition.
2. Gaps in Safety Audits.
In addition, many facilities conduct safety, health and environmental audits using both internal teams and large consulting companies, which require significant resources. An integral part of these audits is to inspect observable near-misses that are reported by employees, which depends upon safety culture at the facility and may not always provide a true picture of risks. Furthermore, these approaches do not have the capability to monitor the change in the process risk levels in real, or even near, time.
3. Gaps in Operations Management and Manufacturing Intelligence Tools.
Operations management and manufacturing intelligence software provide KPIs (key performance indicators) for performance monitoring of operations, and assessment of availability/effectiveness of equipment – however, they focus mostly on trending, reporting, and visual analytics of a select data slice. These systems fall short when it comes to big data analysis, particularly when users need insights on when and how parts of the operation are becoming riskier. With aging equipment and the expected departure of many seasoned operators from the workforce, this handicap becomes even more considerable.
Thus, the need is clear for an approach that helps facilities close the risk assessment gaps that continue to be problematic. Next, we will outline an approach that does identify risk levels and drivers dynamically, without significant resource requirement, and can play an important role in helping busy plant personnel determine the accurate risk levels and take appropriate actions rapidly.
Taking a Different Approach
 The approach and solution we outline is based on knowledge developed through years of research with leading academic institutions and contains patent-pending methodologies that make use of big data – all the process (online sensor) measurements and alarm data. The data is received automatically (via OPC or similar system) and processed rapidly to extract crucial risk information, thus creating leading indicators of potential performance issues, such as shutdowns, accidents, incidents, and operational problems.
The Dynamic Risk Analyzer (DRA) – is designed to close the current gaps in risk assessment approaches. It is predictive, enterprise process risk management software, designed for plant personnel to assess the risk level of their plant’s operations on-demand or periodically (daily, weekly, monthly). It is used to determine when parts of operations are deteriorating, so plant personnel can take preventative action.
The vast amount of data is analyzed and refined to provide a single indicator of the overall risk of the process – the Dynamic Risk IndexTM. While this index gives an overall indicator, the advanced drill-down capabilities from Motion AnalysisTM, Probability AnalysisTM and Derivative AnalysisTM guide plant personnel to the sources and nature of the risk – at the lowest data levels – to deploy the right resources in a timely manner, to plan JIT maintenance, and to head off potential problems – several days or even weeks in advance.
The novel, data-centric, the hidden near-miss framework uses advanced data-mining techniques to harness big data to find new anomalies that cannot be detected using engineering models. Combined with its dynamic approach, DRA empowers operations teams (plant managers, supervisors, and engineers) to discover risks at their formation stage before they become visible or threatening. With its actionable indicators and associated transparency, DRA complements hazard identification and quantitative risk analyses.
Key Features
- Insights into process risk levels of a plant/facility – by harnessing big data (process and alarm data)
- Evaluation of risk trends on a periodic basis (daily, weekly, monthly)
- Actionable leading indicators to point out risky conditions at their developing stages (lacking in current operations management/analytics tools)
- Drill-down capabilities to get to underlying drivers
- Plug-and-play, self-training system
- User-friendly dashboard, easy charting, reporting, and blogger options
Benefits
- Improves safety, reliability, and operability with a predictive, reduced risk profile
- Improves PSM execution by detecting potential process problems in advance
- Provides valuable information for fact-based decision making in planning shutdowns and JIT maintenance
- Helps to monitor the effectiveness of risk reduction measures
- Compares the risk status of different areas in a plant
- Establishes credibility with regulators, auditors, and insurers
How a Big Data Solution (DRA) Works

DRA receives alarm and process data automatically via OPC, historian, or similar systems. The adaptive, hidden near-miss technology is designed to handle changes in the process over time, updating risk estimates dynamically. Thus, it provides the latest insights on risk trends to all levels of plant management, including managers, supervisors, engineers, maintenance crew, as well as operators. The easy-to-use web interface, reporting, and blogging features ensure effective communication and transparency of risks among the plant personnel – making DRA a groundbreaking tool for predictive risk assessment and maintenance.
Case Study I: Unexpected Shutdown at a Refinery
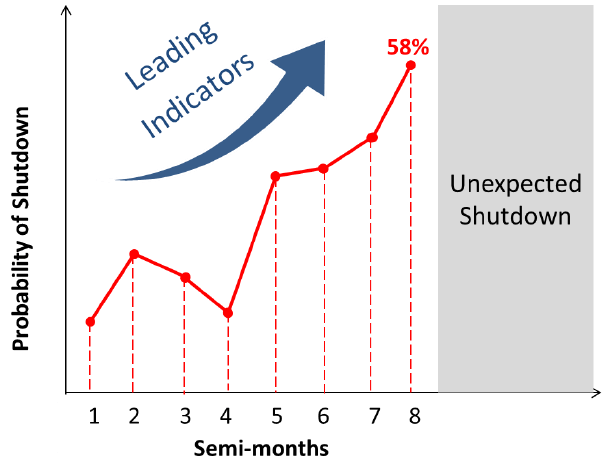
Consider the case study of an industrial fluid-catalytic-cracking-unit in a large refinery, which experienced an unexpected shutdown in the middle of high demand operations. Despite having a strong PSM program and alarm management philosophy in place, the immunity of process to disturbances deteriorated progressively until the disturbances overpowered the controllers one day and led to a shutdown. A post-mortem investigation by DRA, which involved rapid analysis of more than 18 months of data, reveals that the deterioration occurred subtly over a period of several months. But the plant could not see it. DRA identified increasing risk levels for several variables (before shutdown), indicating significant deviations from their normal, long-term behavior – which could not be captured by standard plotting, trending, and visualization of data. In particular, DRA identified a pressure differential variable (for one of the standpipes), exhibiting strong leading indicators before this shutdown. As shown above, one of the leading indicators metrics – the probability of occurrence of shutdown (after crossing safe limits) – increased gradually to 58% over several months. With the gaps that exist in standard risk assessment tools, plant management did not have visibility into the changing conditions.
Equipped with insights from the full range of data pinpointing changing risk levels on a dynamic basis (daily, weekly, monthly), a plant operations team can identify when problems actually start. Going further, plant management and engineers can utilize these leading indicators ex-ante to take proactive measures to prevent and avoid operational problems. Ultimately, this type of knowledge will help engineers and safety personnel point out issues early on, so management can allocate resources to the most needed areas.
Case Study II: Acid Runaway Incident
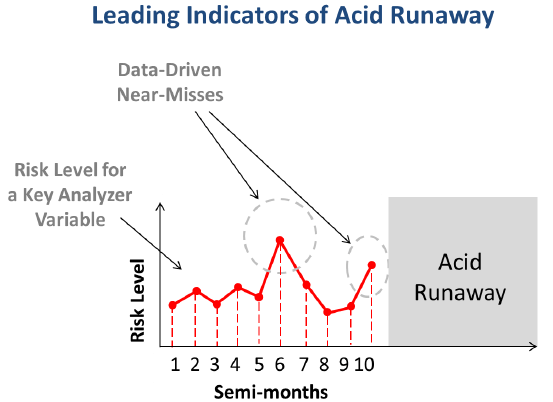
Consider another case study for an industrial plant that experienced an acid runaway incident. The plant was unable to pinpoint the cause of the incident. For this case study, DRA demonstrated that the incident was indeed a progressive event and not a result of sudden human error. One of the important benefits of Dynamic Risk Analyzer technology is its capability to identify the likelihood of normal conditions escalating to abnormal levels and highlight these risks to the operating team (plant managers, supervisors, engineers, and operators). The figure above shows that one of the analyzed variables had been experiencing the significant likelihood of crossing its critical levels for several weeks before the incident. This single piece of information alone could have prevented the incident, with plant personnel taking corrective actions in advance. In particular, there were two periods where the software identified important data-driven near-misses, which indicated events with high-risk potential that were not captured with the existing risk assessment tools.
In general, there are many process conditions like an acid runaway, which are difficult to detect through use of trending and visualization techniques. In such cases, big data analytics can provide tremendous value in highlighting issues that are lost to other approaches and not observable to the human eye.
Everything we need to know is in the data – but it requires big data analytics to separate the important from the insignificant.
Conclusion
Despite technological advances in automation and growing awareness for process safety, it is evident that industrial facilities are still struggling to cope with unexpected shutdowns and incidents. The current risk assessment approaches fall short in their capacity to identify and predict risks on a dynamic basis. However, the solution lies in harnessing process-specific big data, which contains tremendous information on precursors – indicating when risks are at their developing stages. Importantly, this approach is independent of reporting by employees, which has always been insufficient in capturing information. This white paper introduced a predictive, enterprise process risk management technology that utilizes big data to assess risks dynamically and report automatically – empowering plant personnel to identify issues early on and take necessary preventive measures to address them. With associated benefits such as transparency of risk information, automatic capture of problems, fact-based decision making, and effective monitoring of maintenance measures, this new technology lays the foundation for next-generation risk assessment.