Million Dollar Savings per year through optimizing the operating parameters of compressor loop using Cognitive Analytics.
About Customer
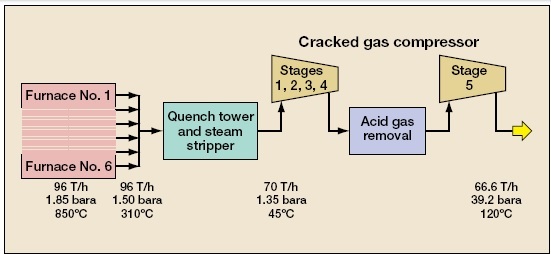
Customer is one of the large petroleum refinery and petrochemical manufacturer in the world. One of their plants produces 15 MMT per annum Ethylene and one MMT of Para Xylene. One of the challenges this producer facing was low efficiency of their Crack Gas Compressor(CGC) of the Ethylene plant. In the entire ethylene production facility, CGC is the most critical unit. This asset can cost as much as $50 million and operates 24/7 under demanding conditions. For a typical 500 KTA capacity ethylene plant, CGC Power accounts for 30 MW/hr of electricity equivalent to $ 20 million per year. Customer wants to optimize CGC operating parameters to improve its efficiency and lower energy consumption. We employed Cognitive Analytics and Data Sciences to analyze the problem and find solutions.

Objective / Challenges
The ethylene production process is inherently rough on equipment including CGC and control systems owing to the extreme temperatures and fouling issues. The potential of equipment fouling is a direct function of the type of feed stock being cracked and cracking severities. Factors that affect the decline in compressor efficiency (thereby, resulting in higher energy consumption) are:
- Varying process fluid composition
- Varying process flow rates and temperatures
- How efficiently heat is removed from exchangers which is dependent on many factors like:
- Fouling of exchanger by coking (i.e. high outlet temperatures).
- High outlet temperature increases fouling rate due to higher coke formation.

Customer technical services team was constantly observing various operating parameters to analyze CGC efficiencies based on plant data from DCS, MES and other systems such as PLC & LIMS. They were using descriptive analytics using data from histogram, pivot tables and reports. They were not able to correlate operating parameters to the CGC efficiency and unable to visualize key indicators. This is due to following reasons
- Lot of explanatory parameters (Over 100 operating parameters just around CGC loop)
- Volume of data was very high to analyze
- Building correlations between parameters was not possible as they were highly interdependent
Due to above challenges, customer had engaged us to use advanced analytics to solve the problem.

Business Solution
We have used cognitive analytics and data sciences to correlate large amount of plant data across several operating parameters. The collected data was engineered to prepare for analysis including feature extraction and model building in the below sequence.
- We created a problem data set comprised of time series data of various online sensors and other measured attributes for a CGC unit. It consisted of 40 measured variables for duration of 4 years.
- Multivariate analysis was used to contextualize large volume of data sets. The approach involved exploiting the naturally occurring correlation structures in these dense data sets owing to flow, mass transfer, energy transfer, and basic thermodynamics.
- Further, we used advanced analytics with machine learning capabilities, to take a deep dive into historical process data, identifying patterns and relationships among discrete process steps and inputs.This information was transcended to provide real time predictions of efficiency and thus, optimizing the parameters that have greatest effect on CGC efficiency.
- Later, design of experiment method was utilized to simulate 6561 experiments that helped us to understand the interaction of variables between each other. From these statistical experiments, the main interaction between process variables and the respective optimum values for higher efficiency were identified. As an example, the below plots shows 4th stage correlations and optimal values for key process indicators.

Figure 2: Interaction Plot of efficiency with Key operating Variables Table 1: Optimum values of the parameters Operating Parameter Optimum value 1st Stage Suction Temperature (oC) 38 – 44 3rd Stage Discharge Pressure (kg/cm2g) 12 - 14 4th Stage Suction Temperature (oC) 45 - 55 4th Stage Suction Pressure (kg/cm2g) 10 - 13 4th Stage Discharge Temperature (oC) 80 - 87 4th Stage Discharge Pressure (kg/cm2g) 24 - 26 5th Stage Suction Pressure (kg/cm2g) 21 - 24 C3 Splitter Purge to 4th Stage Suction (Nm3/hr) 0.5 - 154 - The models, developed based on Advanced Analytics were informative to predict the required parameters for minimization of power consumption and maintaining higher efficiencies.
- Tools and analytics like alerts were built around these predictions to present actionable inputs to the end-users.
- Based on alerts of heat exchanger outlet temperatures, BFW injection rate to compressor stages and cooling water flow to these critical exchangers were optimized.
- Based on inter-stage differential pressure alerts, wash oil dosing to relevant exchangers and compressor stages was carried out to mitigate the fouling.

Business Benefits
- Cognitive analytics and data sciences helped to correlate large amount of plant data across several operating parameters and predict optimal operating values for key process parameters upon which CGC efficiency was highly dependent.
- Overall, the facility realized 5% reduction in power consumption equivalent to 1 MW and it was feasible to extend the turnaround maintenance schedule by 6 ~8months (i.e. 15%). The total saving was about a million dollars.
- We were able to deliver this value as Cognitive analytics and data sciences allow processing large Volume of data with Veracity, Velocity and Variety to analyze and find correlations for predicting optimal values for key process indicators.

