
Heat Exchanger fouling prediction model to improve productivity & power consumption.
About Customer
- Customer is a major petrochemical complex in the Middle East, with 500,000 Tons/year Ethylene production.
- The ethylene production process itself is inherently tough on equipment like owing to extreme temperatures and fouling services.
- Equipment fouling potential is a direct function of the type of feedstock being cracked and cracking severities.
- Exchanger & Compressor fouling can have a deleterious impact on:
- Overall plant performance,
- Economic penalties in energy
- Productivity losses and
- Maintenance cost.

Objective / Challenges
- Conventional heat transfer models require 6 process parameters (Flow, inlet & outlet temperature on both shell and tube sides) to estimate fouling.
- In practice only 4 out of 6 parameters are available and Customer technical services could not estimate fouling using domain expertise.
- This is due to the following reasons
- Limited explanatory parameters to build models based on Thermodynamics.
- Building correlations between parameters was not possible as they were highly interdependent.
- Due to the above challenges, the customer had engaged us to use advanced analytics to solve the problem
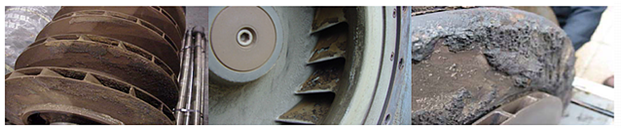
Example of deteriorated Compressor due to fouling.
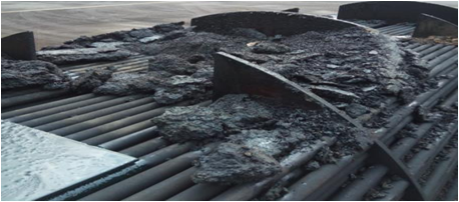
Example of After Cooler fouling after into service.
Solution to problem
- A major goal of our study is to understand fouling occurring in exchangers of the cracked loop and find a proxy/surrogate measure of fouling. This measure will aid in real-time monitoring of fouling.
- We have generated a new feature “Fouling Indicator”, through our domain expertise to be a proxy variable to measure fouling.
- Predictive Algorithms were developed using various classification, clustering, and regression algorithms to predict the fouling rate.
- The remarkable similarity is observed between different fouling cycles.
- Magnitude differences due to throughput changes in operation were minimized through normalization of the variables.
- Built grid optimization sub-process to automatically select and shortlist the most optimum algorithm. deep-learning was the best model to predict the fouling with precision and accuracy.

Time series plot of fouling indicator after normalization/ detrending.
Benefits realized
- Predictive algorithm along with our proxy variable could classify the fouling into three different classes, viz. ;
- Class 1: Normal Operation
- Class 2: Suspected Fouling
- Class 3: High Fouling / “Needs Immediate Action”
- This variable will directly predict fouling and the days remaining till cleaning of the exchanger is imminent.
